When Christina Yakomin (@SREChristina) started her journey toward synthetic monitoring, she owned a platform for containerized applications and all of the underlying infrastructure. But she didn't own the applications themselves that were deployed to that infrastructure. This consisted of some application servers, cache servers, and web servers.
When she came onto the team, they had robust monitoring in place.
The problem: Defining healthy
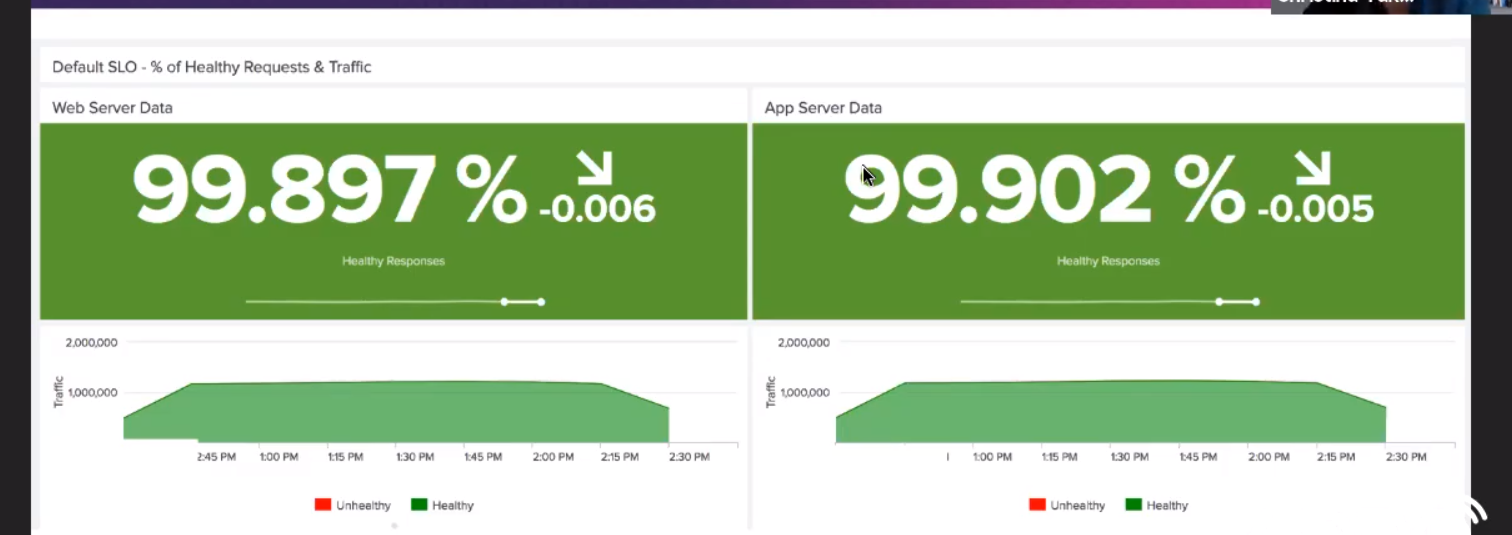
But, in spite of that, it was actually pretty difficult to define what "healthy" was going to mean. For the platform, they decided to broadly consider that anything below a 500 is healthy, and that anything faster than three seconds would be a healthy response time.
They defined alerts for all of this, and everything was great… at least until she was on call for the first time. She was awakened by many calls, including false alarms.
So what gave?
Monitoring percentages
In her case, it was that a small number of apps represented a large portion of the total traffic. So, anything happening to those apps disproportionately skewed the aggregate metrics and sent her a false alarm.
What to do? Well, next up was to monitor the percentage of healthy services.
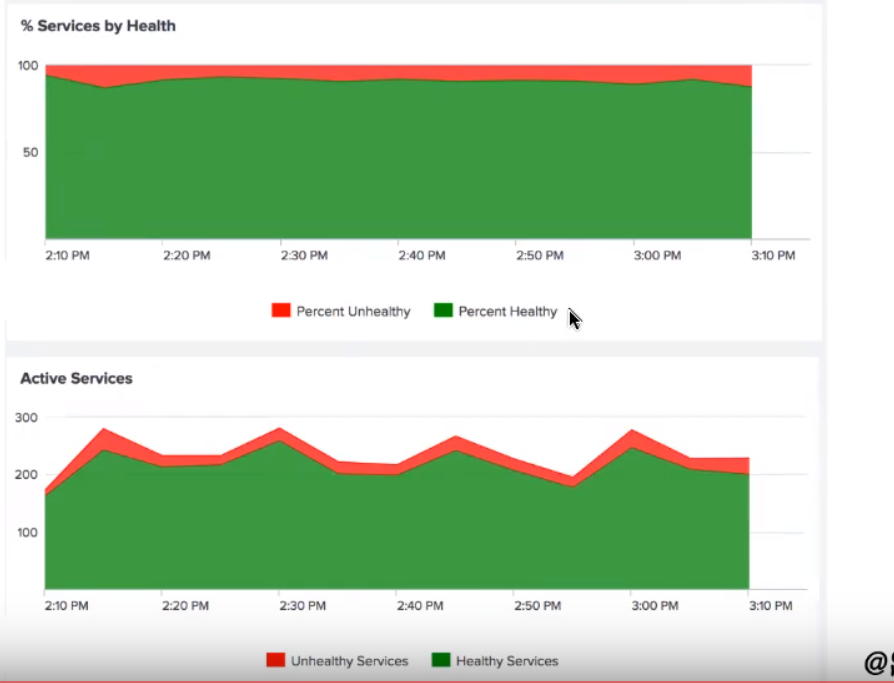
But the false alarms continued. Why?
Well, because a small number of bad services were throwing off the service level.
Synthetic monitoring
Next up, they decided to look into synthetic monitoring: Artificially generated traffic to an application, mimicking the patterns of a typical user. This has a few advantages:
- Traffic is controlled.
- It complements real-traffic monitoring.
- It mimics real user patterns.
Here was their first iteration of synthetic monitoring:
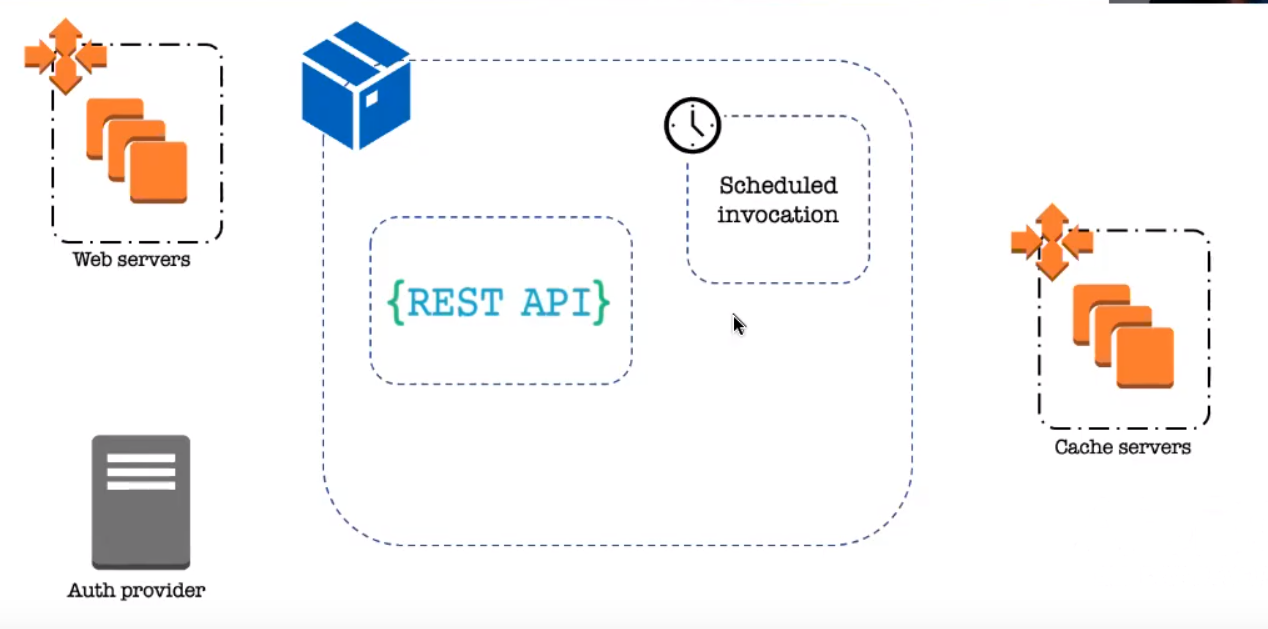
Providing this REST API for the synthetic monitoring allowed her to generate this interesting visualization of traffic through the system.
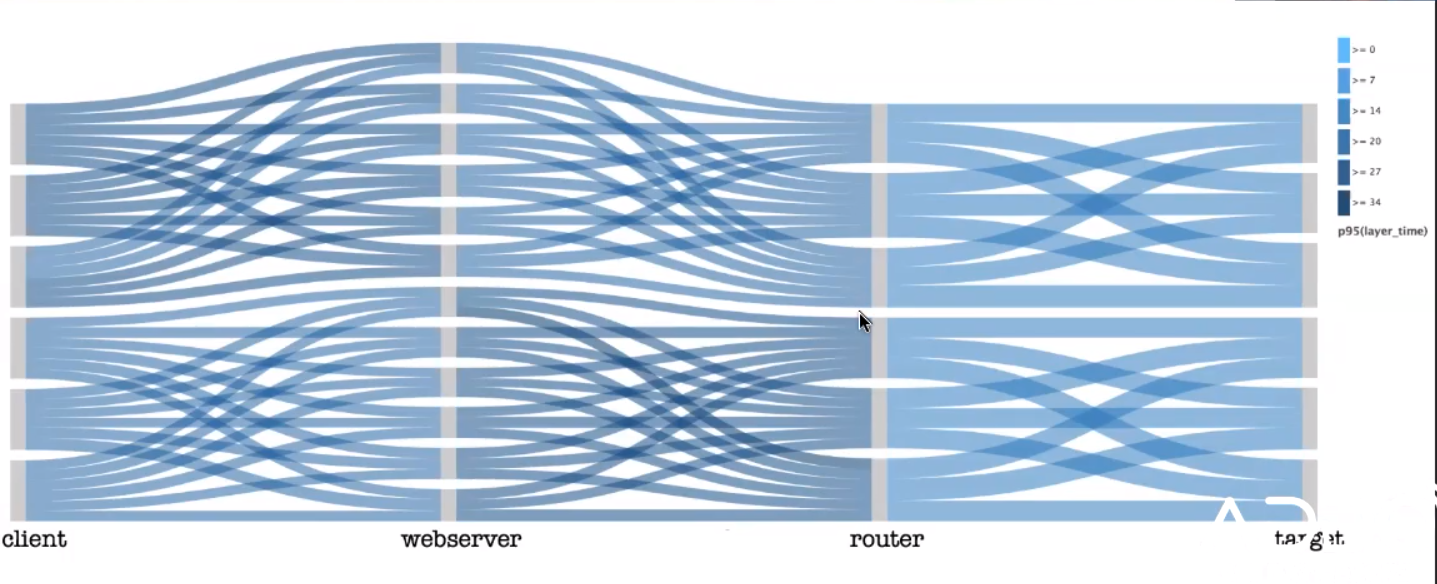
The thickness of the line represents the traffic volume flowing from point A to point B, through the system. This is a good example where the load balancer is working and the lines are even. The darkness of the line indicates latency, per the legend on the side of the screen.
So, at a glance, you can see where requests are going, how evenly, and how long it's taking. Alerts can be more sensitive while generating fewer false alarms.
However, there was a flaw. The API and the monitoring tool were in the same container. So, if anything happened to the container, it also happened to the monitoring capability.
Isolation
So she needed a layer of isolation. She needed to separate the API from the monitoring.
Here's the result of that.
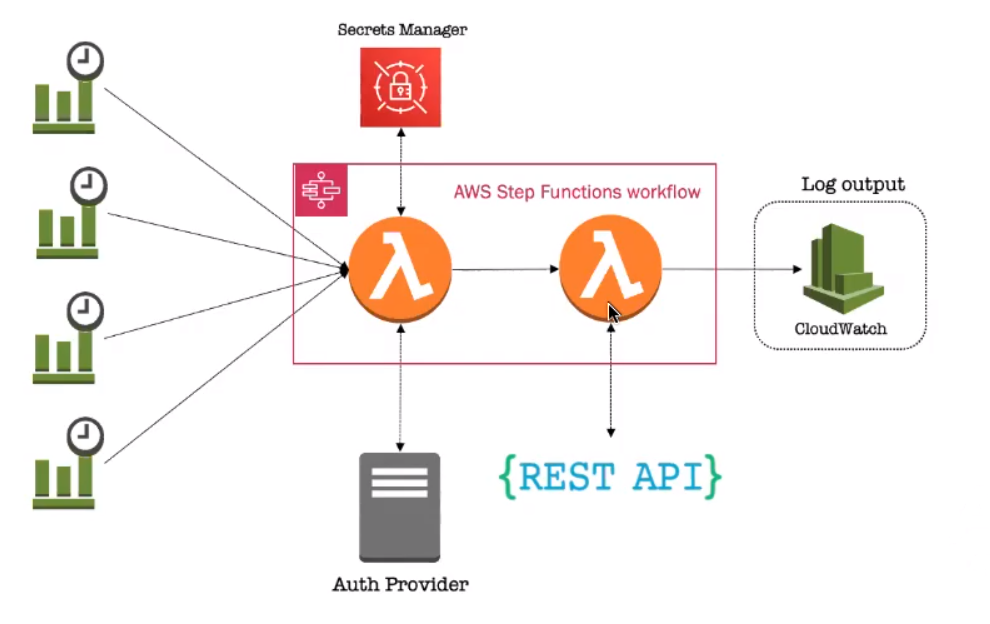
Screenshot from Christina Yakomin's "Observability Made Easy" presentation.
On the left are CloudWatch rules, which, on a chron schedule invoke the state machine and go to two lambda functions. The first one talks to the secrets manager to grab credentials, and uses them to talk to the auth provider, which supplies a token. This is passed along to the second lambda function, which makes the REST request via a Python script. It makes the request and stores the results in the CloudWatch log output.
Why is this better? Well:
- It's isolated, so it can be available independent of the platform's availability.
- It's serverless, so it's cheap and even more highly available.
- It's global, which allows them to source their monitoring from anywhere that runs AWS Lambda, allowing for more accuracy in estimating client experience for global clientele.
So why not go with a vendor solution?
Well, vendor solutions are great, but she already had some of the components for this in house. And the products that she evaluated had some shortcomings, such as a lack of auth integration, expensiveness, and lockdown by a security team. With nothing ideal, and the simplicity of the Python approach, it seemed like a good idea to do it this way.
So if you find yourself in a situation like Christina's, where a vendor solution just won't work, perhaps hers can serve as the inspiration for creating what you need.